Technical Analysis: Week 21, 2025
(GBP/USD | AUD/USD | Silver)
Welcome to your weekly edge in the markets, brought to you by WeTrade in collaboration with Trading Writers.
This report is designed to give you clear, actionable insights each week. It’s split into two parts:
1. Weekly Thoughts – practical trading strategies, tips, and educational ideas to help sharpen your skills.
2. Setups & Signals – our top 3 trade ideas for the week, complete with charts and key levels to watch.
Weekly Thoughts
Taking ‘longer term trades’ that last a few weeks in forex markets makes you a position trader.
This is a quick guide to holding longer term positions with a small account.
Here’s the issue I want to address:
“I have to be a day trader because I’ve only got X bucks in my trading account”
There is an element of truth to the above statement. Having more money in your account gives you more choices for the way you can trade.
This is less of an issue for trading stocks, especially thanks to fractional shares but can be a big issue trading forex.
But - thanks in large part to micro lots - you will see below that you still have a lot of choices with a small account.
The style of trading you do should not be based solely on how much money is in your account- it should be based mostly around what style of trading suits you best.
Let’s dig into a more specific example about how this can work.
Position Trading Example
A position trader, who typically holds trades for weeks at a time, needs to place stops well beyond daily noise and the typical price swings that occur in any given week.
Try this: Add the Average True Range (ATR) indicator onto your MT4 chart of EURUSD. Take note of the value on the daily chart and on the weekly chart.
As of May 21, EUR/USD has a 14-day ATR of 104 pips and a 14-week ATR of 217 pips.
This indicator gives you a good guide as to how many pips a currency pair moves on average per day and per week. This in turn gives us a good guide to how to place our stop losses given the typical volatility and relative to our profit target.
OK, what kind of profit target does a position trader aim for?
Well, we now know that if you bought the absolute low of the week and sold at the absolute top then you can on average expect to earn 217 pips. That would be a very impressive (read nearly impossible) feat if you do it.
More likely you can catch the middle 50-70% of that weekly price range. So it’s more likely to take you around 2 weeks to make a profit of 200 pips.
How long it takes a trade to reach a stop or profit target depends on market volatility and the strength of the trend at the time. But to give you a rough guide, we’ve created the below table:
How Long Would It Take to Reach a Target?
|
? Target |
⌛ Estimated Time |
? Reason |
|
100 pips |
<1 week |
Easily doable within a single strong trend week |
|
200 pips |
~2 weeks |
May happen in 1 week, but safer to assume 2 |
|
300 pips |
~2–4 weeks |
Requires trend continuation without significant reversal |
|
400 pips |
~4-6 weeks |
You’re riding a sustained macro move or breakout |
|
500+ pips |
2–4 months |
These are rare, high-conviction trades, possibly part of a major trend |
What Does a ‘Position Trade’ Look Like?
- Weekly ATR: ~217 pips
- Expected directional move: ~130 pips/week (realistically capturing ~60% of total range)
? Stop Loss
100–150 pips makes sense to me
- Wide enough to withstand normal weekly noise and pullbacks
- Tight enough to limit exposure if the trade idea is wrong
? Profit Target
300+ pips target:
- Aiming for roughly 2–3x the stop loss, consistent with classic risk-reward principles
- Achievable over 2–4 weeks if trend holds and volatility stays elevated
Let’s calculate position sizes for a position trade on EUR/USD using:
- A stop loss of 130 pips
- A risk-per-trade of 2%
- Account sizes: $500, $1,000, and $2,000
As we all know, a standard contract is worth around $100K (depending on the forex pair).
A mini lot is $10,000 and a micro lot is $1000.
Position Size Calculations
|
Account |
Risk $ |
Stop (pips) |
Pip Value Allowed |
Lot Size = Pip Value ÷ 0.10 |
|
$500 |
$10 |
130 |
$0.08 |
0.008 lots (~800 units) |
|
$1,000 |
$20 |
130 |
$0.15 |
0.015 lots (~1,500 units) |
|
$2,000 |
$40 |
130 |
$0.30 |
0.03 lots (~3,000 units) |
A micro lot position is shown as ‘0.01’ in Metatrader 4 (see below).
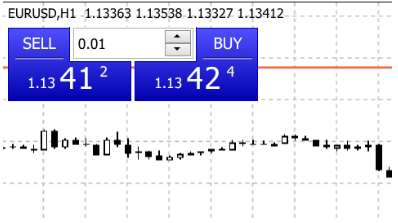
So actually, if you are limiting your risk to 2% per trade it is not possible to position trade with a $500 account. However, with a $1000 account, you can trade 0.015 lots in MT4 and risk $20 (2% of your equity).
With a $2000 account you can trade 0.30 lots, which is even better because you also have the option of scaling in and out of a position with 3 separate orders of 0.1 lot at a time.
I know what you’re thinking. I don’t want to wait 3-4 weeks to make $40!
That’s not the point, if you can make $40 - you can logically make $400 (10X) or $4000 (100X) with larger positions once you have access to a larger account.
NOTE: Don’t worry if you couldn’t grasp the maths in the above straight away. Reread it until you do ;)
Setups & Signals
We look at hundreds of charts each week and present you with three of our favourite setups and signals.
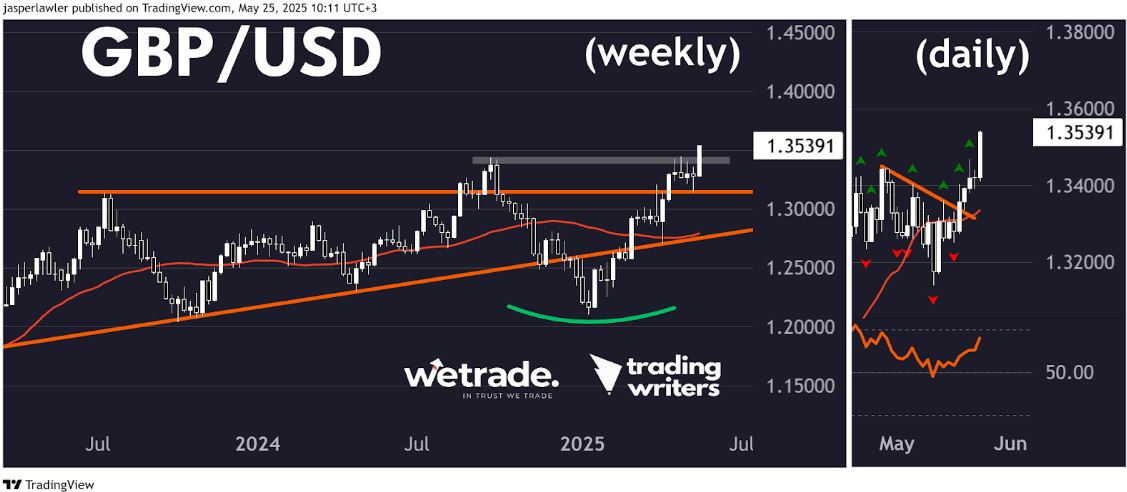
GBP/USD
Setup
We have turned bullish on the failed double top and breakout to multi-year highs. We will maintain this bullish bias while above 1.34.
Signal
GBP/USD has broken out with a move over the 2024 peak and the psychological 1.35 round number. The move higher in GBP is corroborated by a breakdown in USD across several major pairs.
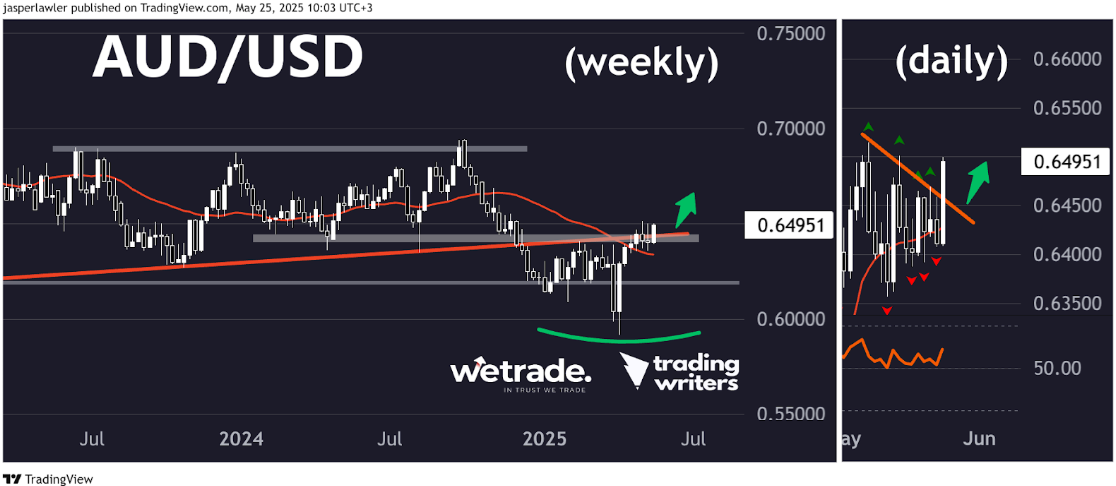
AUD/USD
Setup
Aussie has broken above former support turned resistance around 1.63-64 with its highest weekly close this year. The failed resistance is bullish.
Signal
AUDUSD has broken out of a triangle pattern on the daily chart. It has not yet cleared the May highs so the top trendline of the triangle offers an earlier entry point but with less confirmation. A move back into the triangle would negate the signal.
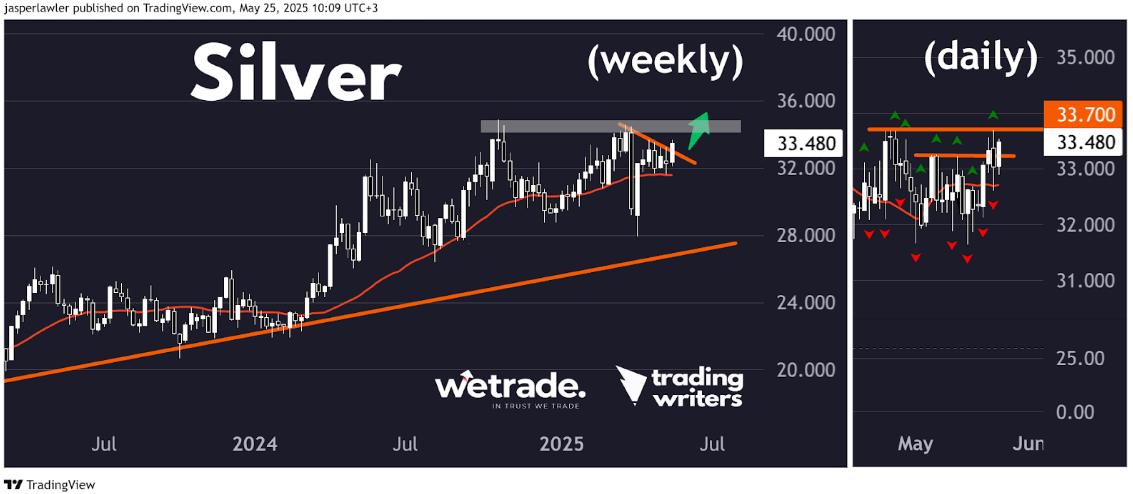
Silver (XAG/USD)
Setup
Silver’s quick recovery from the March lows, having also held the 30-week moving average in a tight consolidation before closing at a multi-week high is bullish.
Signal
A breakout of the near term high at 33.70 offers again an earlier entry than a multi-year high over 35 with less confirmation. The broken trendline should act as near term support.
But - as always - that’s just how the team and I are seeing things, what do you think?
Share your ideas with us - OR - send us a request!
Trade with WeTrade!
Every position closed is one step closer to unlocking WeTrade Honours privileges and redeeming exclusive rewards.
Start your trading journey here - Register now
Kickstart your trading of the week here - Login Now